UNITED STATES
SECURITIES AND EXCHANGE COMMISSION
WASHINGTON, D.C. 20549
FORM
CURRENT REPORT
Pursuant to Section 13 or 15(d) of the
Securities Exchange Act of 1934
Date of Report (Date of Earliest Event Reported):
(Exact name of registrant as specified in its charter) |
| | |||
(State or other jurisdiction | (Commission | (I.R.S. Employer | ||
of incorporation) | File Number) | Identification No.) |
| ||
(Address of principal executive offices) |
| (Zip Code) |
Registrant’s telephone number, including area code:
Not Applicable |
Former name or former address, if changed since last report |
(Exact name of registrant as specified in its charter) |
| | |||
(State or other jurisdiction | (Commission | (I.R.S. Employer | ||
of incorporation) | File Number) | Identification No.) |
| ||
(Address of principal executive offices) |
| (Zip Code) |
Registrant’s telephone number, including area code:
Not Applicable |
Former name or former address, if changed since last report |
(Exact name of registrant as specified in its charter) |
| | |||
(State or other jurisdiction | (Commission | (I.R.S. Employer | ||
of incorporation) | File Number) | Identification No.) |
| ||
(Address of principal executive offices) |
| (Zip Code) |
Registrant’s telephone number, including area code:
Not Applicable |
Former name or former address, if changed since last report |
(Exact name of registrant as specified in its charter) |
| | |||
(State or other jurisdiction | (Commission | (I.R.S. Employer | ||
of incorporation) | File Number) | Identification No.) |
| ||
(Address of principal executive offices) |
| (Zip Code) |
Registrant’s telephone number, including area code:
Not Applicable |
Former name or former address, if changed since last report |
Check the appropriate box below if the Form 8-K filing is intended to simultaneously satisfy the filing obligation of the registrant under any of the following provisions:
Indicate by check mark whether the registrant is an emerging growth company as defined in Rule 405 of the Securities Act of 1933 (§230.405 of this chapter) or Rule 12b-2 of the Securities Exchange Act of 1934 (§240.12b-2 of this chapter).
Ferrellgas Partners, L.P.
Emerging growth company
If an emerging growth company, indicate by check mark if the registrant has elected not to use the extended transition period for complying with any new or revised financial accounting standards provided pursuant to Section 13(a) of the Exchange Act. ☐
Ferrellgas Partners Finance Corp.
Emerging growth company
If an emerging growth company, indicate by check mark if the registrant has elected not to use the extended transition period for complying with any new or revised financial accounting standards provided pursuant to Section 13(a) of the Exchange Act. ☐
Ferrellgas, L.P.
Emerging growth company
If an emerging growth company, indicate by check mark if the registrant has elected not to use the extended transition period for complying with any new or revised financial accounting standards provided pursuant to Section 13(a) of the Exchange Act. ☐
Ferrellgas Finance Corp.
Emerging growth company
If an emerging growth company, indicate by check mark if the registrant has elected not to use the extended transition period for complying with any new or revised financial accounting standards provided pursuant to Section 13(a) of the Exchange Act. ☐
Securities registered pursuant to Section 12(b) of the Act:
Title of each class | | Trading Symbol(s) | | Name of each exchange on which registered |
N/A |
Item 7.01 Regulation FD Disclosure
The registrants are furnishing this Current Report on Form 8-K to make publicly available an investor presentation which the registrants may use in future meetings with current and potential investors and analysts. A copy of the investor presentation is attached to this Current Report on Form 8-K as Exhibit 99.1 and is incorporated by reference in this Item 7.01.
The information contained in this Item 7.01 and in the accompanying Exhibit 99.1 are deemed to be “furnished” and shall not be deemed “filed” for purposes of Section 18 of the Securities Exchange Act of 1934, as amended (the “Exchange Act”), or incorporated by reference in any filing under the Exchange Act or the Securities Act of 1933, as amended, except as shall be expressly set forth by specific reference in such filing.
Item 9.01 Financial Statements and Exhibits
(d) Exhibits.
Exhibit No. | | Description |
99.1 | ||
104 | Cover Page Interactive Data File (embedded within the Inline XBRL document). |
SIGNATURES
Pursuant to the requirements of the Securities Exchange Act of 1934, each registrant has duly caused this report to be signed on its behalf by the undersigned hereunto duly authorized.
FERRELLGAS PARTNERS, L.P. | ||
By: | Ferrellgas, Inc., its general partner | |
Date: November 2, 2026 | By: | /s/ Tamria A. Zertuche |
Chief Executive Officer and President | ||
FERRELLGAS PARTNERS FINANCE CORP. | ||
Date: November 2, 2026 | By: | /s/ Tamria A. Zertuche |
Chief Executive Officer and President | ||
FERRELLGAS, L.P. | ||
By: | Ferrellgas, Inc., its general partner | |
Date: November 2, 2026 | By: | /s/ Tamria A. Zertuche |
Chief Executive Officer and President | ||
FERRELLGAS FINANCE CORP. | ||
Date: November 2, 2026 | By: | /s/ Tamria A. Zertuche |
Chief Executive Officer and President | ||
Exhibit 99.1
| FERRELLGAS INVESTOR PRESENTATION November 2026 |
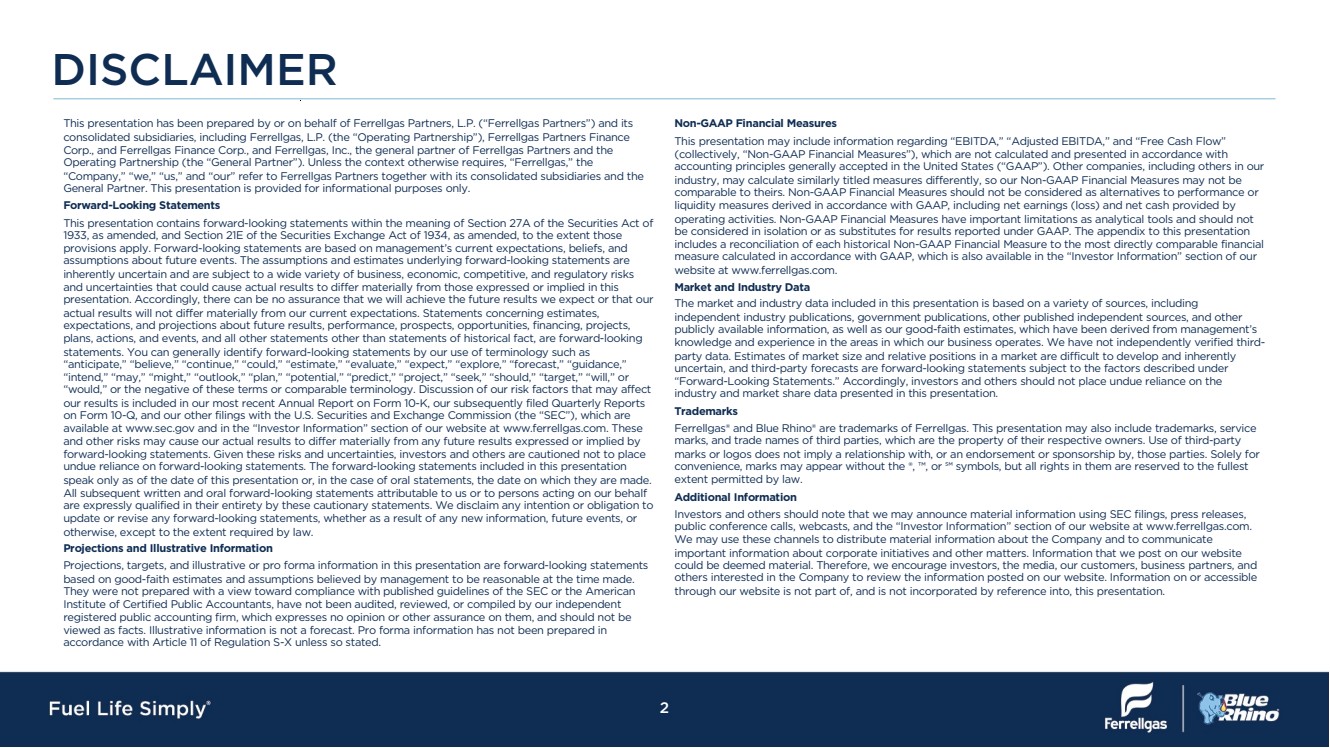
| DISCLAIMER 2 This presentation has been prepared by or on behalf of Ferrellgas Partners, L.P. (“Ferrellgas Partners”) and its consolidated subsidiaries, including Ferrellgas, L.P. (the “Operating Partnership”), Ferrellgas Partners Finance Corp., and Ferrellgas Finance Corp., and Ferrellgas, Inc., the general partner of Ferrellgas Partners and the Operating Partnership (the “General Partner”). Unless the context otherwise requires, “Ferrellgas,” the “Company,” “we,” “us,” and “our” refer to Ferrellgas Partners together with its consolidated subsidiaries and the General Partner. This presentation is provided for informational purposes only. Forward-Looking Statements This presentation contains forward-looking statements within the meaning of Section 27A of the Securities Act of 1933, as amended, and Section 21E of the Securities Exchange Act of 1934, as amended, to the extent those provisions apply. Forward-looking statements are based on management’s current expectations, beliefs, and assumptions about future events. The assumptions and estimates underlying forward-looking statements are inherently uncertain and are subject to a wide variety of business, economic, competitive, and regulatory risks and uncertainties that could cause actual results to differ materially from those expressed or implied in this presentation. Accordingly, there can be no assurance that we will achieve the future results we expect or that our actual results will not differ materially from our current expectations. Statements concerning estimates, expectations, and projections about future results, performance, prospects, opportunities, financing, projects, plans, actions, and events, and all other statements other than statements of historical fact, are forward-looking statements. You can generally identify forward-looking statements by our use of terminology such as “anticipate,” “believe,” “continue,” “could,” “estimate,” “evaluate,” “expect,” “explore,” “forecast,” “guidance,” “intend,” “may,” “might,” “outlook,” “plan,” “potential,” “predict,” “project,” “seek,” “should,” “target,” “will,” or “would,” or the negative of these terms or comparable terminology. Discussion of our risk factors that may affect our results is included in our most recent Annual Report on Form 10-K, our subsequently filed Quarterly Reports on Form 10-Q, and our other filings with the U.S. Securities and Exchange Commission (the “SEC”), which are available at www.sec.gov and in the “Investor Information” section of our website at www.ferrellgas.com. These and other risks may cause our actual results to differ materially from any future results expressed or implied by forward-looking statements. Given these risks and uncertainties, investors and others are cautioned not to place undue reliance on forward-looking statements. The forward-looking statements included in this presentation speak only as of the date of this presentation or, in the case of oral statements, the date on which they are made. All subsequent written and oral forward-looking statements attributable to us or to persons acting on our behalf are expressly qualified in their entirety by these cautionary statements. We disclaim any intention or obligation to update or revise any forward-looking statements, whether as a result of any new information, future events, or otherwise, except to the extent required by law. Projections and Illustrative Information Projections, targets, and illustrative or pro forma information in this presentation are forward-looking statements based on good-faith estimates and assumptions believed by management to be reasonable at the time made. They were not prepared with a view toward compliance with published guidelines of the SEC or the American Institute of Certified Public Accountants, have not been audited, reviewed, or compiled by our independent registered public accounting firm, which expresses no opinion or other assurance on them, and should not be viewed as facts. Illustrative information is not a forecast. Pro forma information has not been prepared in accordance with Article 11 of Regulation S-X unless so stated. Non-GAAP Financial Measures This presentation may include information regarding “EBITDA,” “Adjusted EBITDA,” and “Free Cash Flow” (collectively, “Non-GAAP Financial Measures”), which are not calculated and presented in accordance with accounting principles generally accepted in the United States (“GAAP”). Other companies, including others in our industry, may calculate similarly titled measures differently, so our Non-GAAP Financial Measures may not be comparable to theirs. Non-GAAP Financial Measures should not be considered as alternatives to performance or liquidity measures derived in accordance with GAAP, including net earnings (loss) and net cash provided by operating activities. Non-GAAP Financial Measures have important limitations as analytical tools and should not be considered in isolation or as substitutes for results reported under GAAP. The appendix to this presentation includes a reconciliation of each historical Non-GAAP Financial Measure to the most directly comparable financial measure calculated in accordance with GAAP, which is also available in the “Investor Information” section of our website at www.ferrellgas.com. Market and Industry Data The market and industry data included in this presentation is based on a variety of sources, including independent industry publications, government publications, other published independent sources, and other publicly available information, as well as our good-faith estimates, which have been derived from management’s knowledge and experience in the areas in which our business operates. We have not independently verified third-party data. Estimates of market size and relative positions in a market are difficult to develop and inherently uncertain, and third-party forecasts are forward-looking statements subject to the factors described under “Forward-Looking Statements.” Accordingly, investors and others should not place undue reliance on the industry and market share data presented in this presentation. Trademarks Ferrellgas® and Blue Rhino® are trademarks of Ferrellgas. This presentation may also include trademarks, service marks, and trade names of third parties, which are the property of their respective owners. Use of third-party marks or logos does not imply a relationship with, or an endorsement or sponsorship by, those parties. Solely for convenience, marks may appear without the ®, ™, or ℠ symbols, but all rights in them are reserved to the fullest extent permitted by law. Additional Information Investors and others should note that we may announce material information using SEC filings, press releases, public conference calls, webcasts, and the “Investor Information” section of our website at www.ferrellgas.com. We may use these channels to distribute material information about the Company and to communicate important information about corporate initiatives and other matters. Information that we post on our website could be deemed material. Therefore, we encourage investors, the media, our customers, business partners, and others interested in the Company to review the information posted on our website. Information on or accessible through our website is not part of, and is not incorporated by reference into, this presentation. |
| COMPANY OVERVIEW 3 |

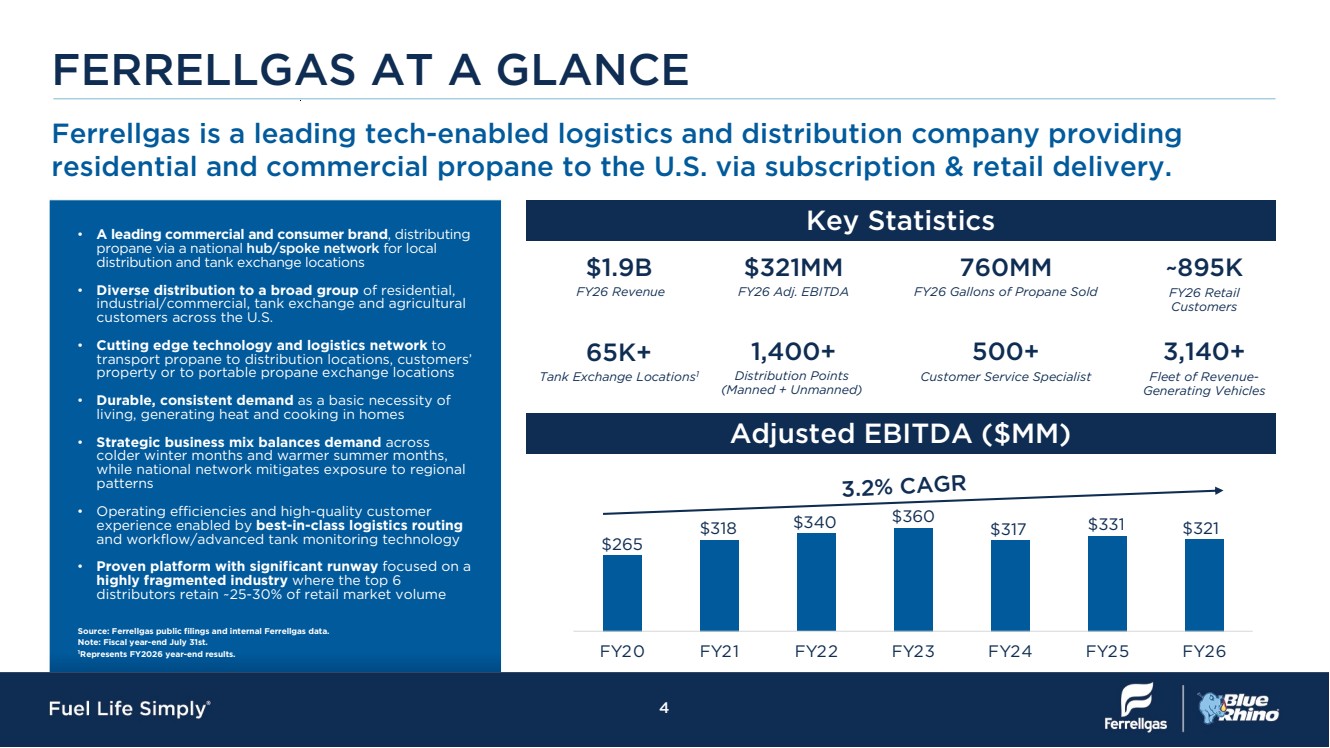
| Ferrellgas is a leading tech-enabled logistics and distribution company providing residential and commercial propane to the U.S. via subscription & retail delivery. Key Statistics Adjusted EBITDA ($MM) FERRELLGAS AT A GLANCE • A leading commercial and consumer brand, distributing propane via a national hub/spoke network for local distribution and tank exchange locations • Diverse distribution to a broad group of residential, industrial/commercial, tank exchange and agricultural customers across the U.S. • Cutting edge technology and logistics network to transport propane to distribution locations, customers’ property or to portable propane exchange locations • Durable, consistent demand as a basic necessity of living, generating heat and cooking in homes • Strategic business mix balances demand across colder winter months and warmer summer months, while national network mitigates exposure to regional patterns • Operating efficiencies and high-quality customer experience enabled by best-in-class logistics routing and workflow/advanced tank monitoring technology • Proven platform with significant runway focused on a highly fragmented industry where the top 6 distributors retain ~25-30% of retail market volume Source: Ferrellgas public filings and internal Ferrellgas data. Note: Fiscal year-end July 31st. 1 Represents FY2026 year-end results. $1.9B $321MM 760MM ~895K 65K+ 1,400+ 500+ 3,140+ FY26 Revenue FY26 Adj. EBITDA FY26 Gallons of Propane Sold FY26 Retail Customers Tank Exchange Locations1 Distribution Points (Manned + Unmanned) Customer Service Specialist Fleet of Revenue-Generating Vehicles FY20 FY21 FY22 FY23 FY24 FY25 FY26 $265 $318 $340 $360 $317 $331 3.2% CAGR 4 $321 |
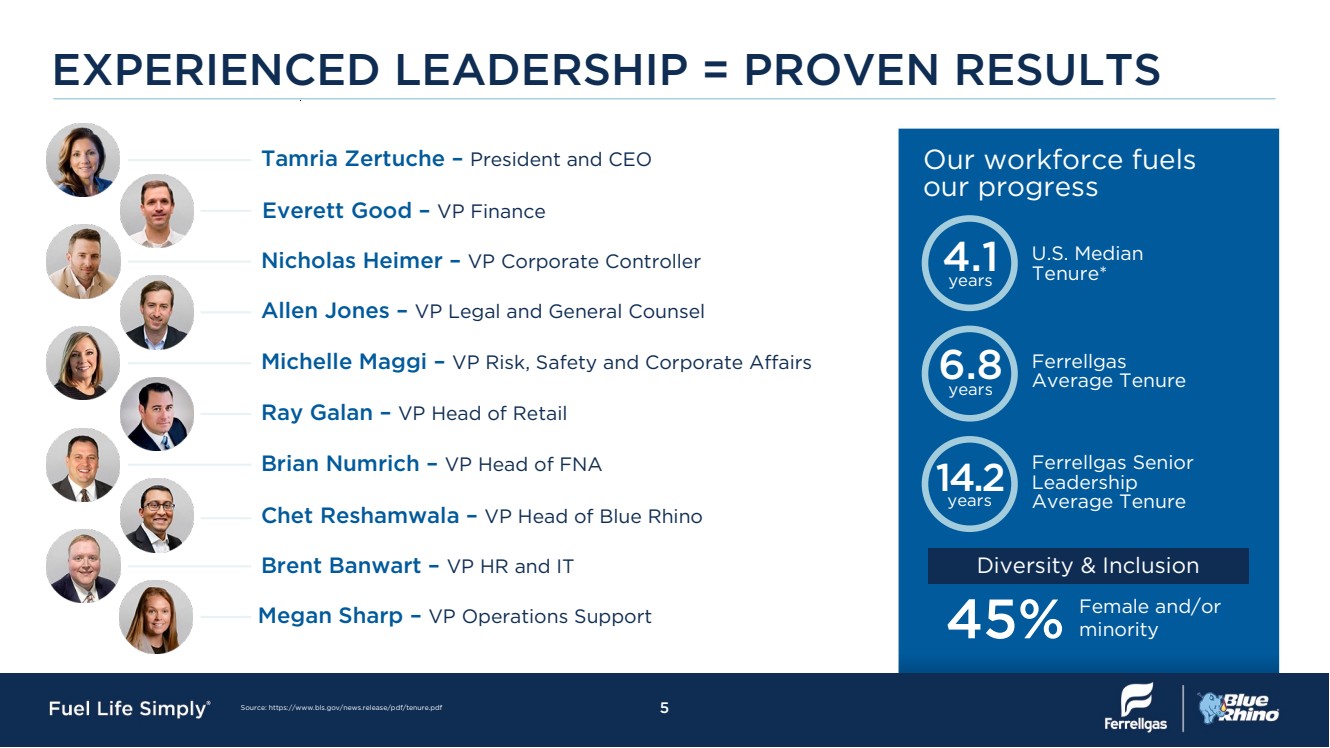
| EXPERIENCED LEADERSHIP = PROVEN RESULTS Our workforce fuels our progress Diversity & Inclusion U.S. Median 4.1 Tenure* years Ferrellgas 6.8 Average Tenure years Ferrellgas Senior Leadership Average Tenure 14.2 years 45% Female and/or minority Source: https://www.bls.gov/news.release/pdf/tenure.pdf 5 Michelle Maggi – VP Risk, Safety and Corporate Affairs Tamria Zertuche – President and CEO Nicholas Heimer – VP Corporate Controller Allen Jones – VP Legal and General Counsel Ray Galan – VP Head of Retail Brian Numrich – VP Head of FNA Chet Reshamwala – VP Head of Blue Rhino Brent Banwart – VP HR and IT Megan Sharp – VP Operations Support Everett Good – VP Finance |
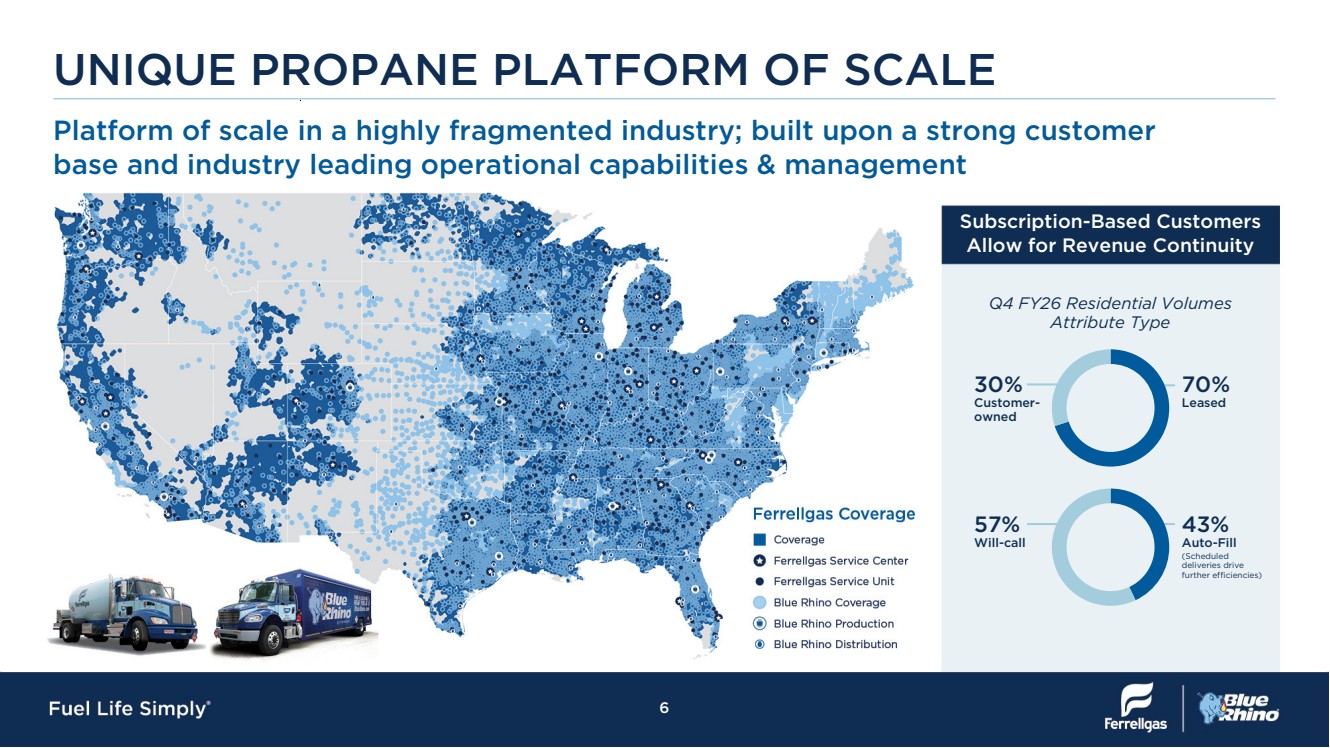
| Platform of scale in a highly fragmented industry; built upon a strong customer base and industry leading operational capabilities & management UNIQUE PROPANE PLATFORM OF SCALE 30% Customer-owned 70% Leased 57% Will-call 43% Auto-Fill (Scheduled deliveries drive further efficiencies) Q4 FY26 Residential Volumes Attribute Type Subscription-Based Customers Allow for Revenue Continuity 6 |
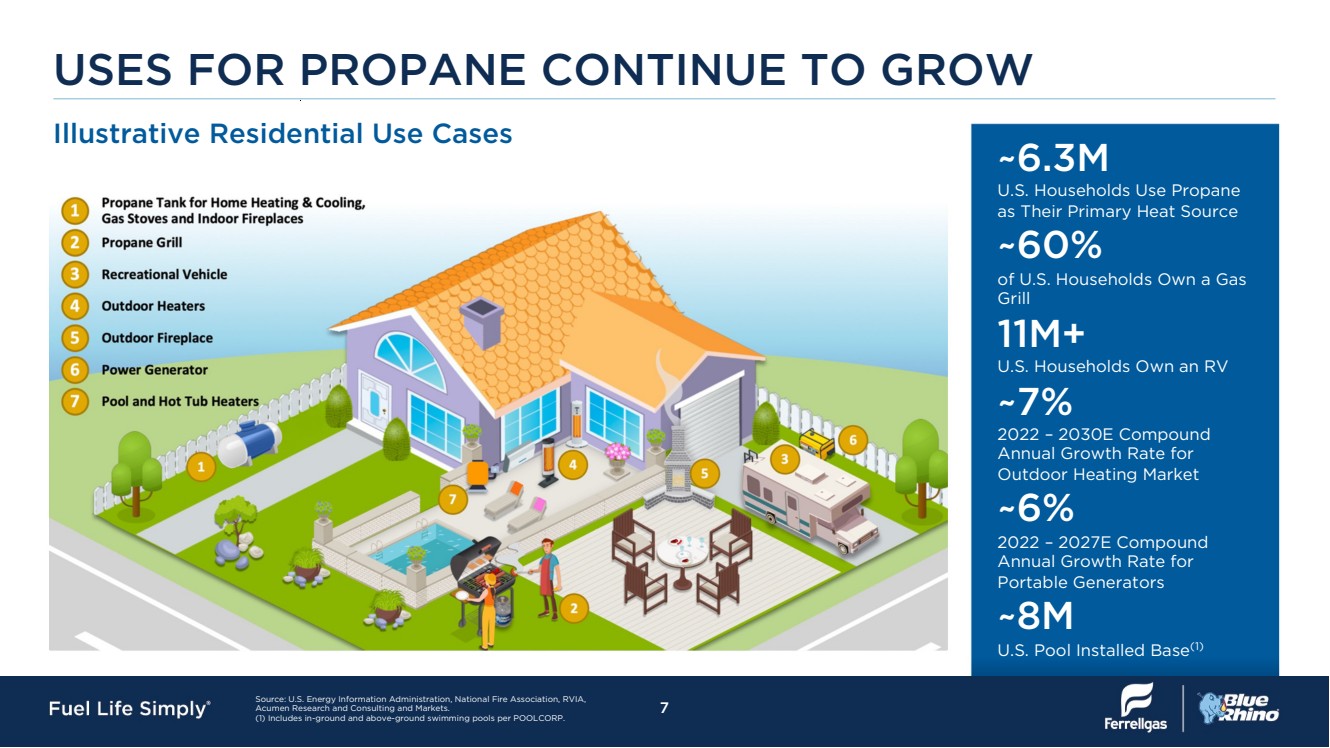
| Illustrative Residential Use Cases USES FOR PROPANE CONTINUE TO GROW ~6.3M U.S. Households Use Propane as Their Primary Heat Source ~60% of U.S. Households Own a Gas Grill 11M+ U.S. Households Own an RV ~7% 2022 – 2030E Compound Annual Growth Rate for Outdoor Heating Market ~6% 2022 – 2027E Compound Annual Growth Rate for Portable Generators ~8M U.S. Pool Installed Base(1) Source: U.S. Energy Information Administration, National Fire Association, RVIA, Acumen Research and Consulting and Markets. (1) Includes in-ground and above-ground swimming pools per POOLCORP. 7 |
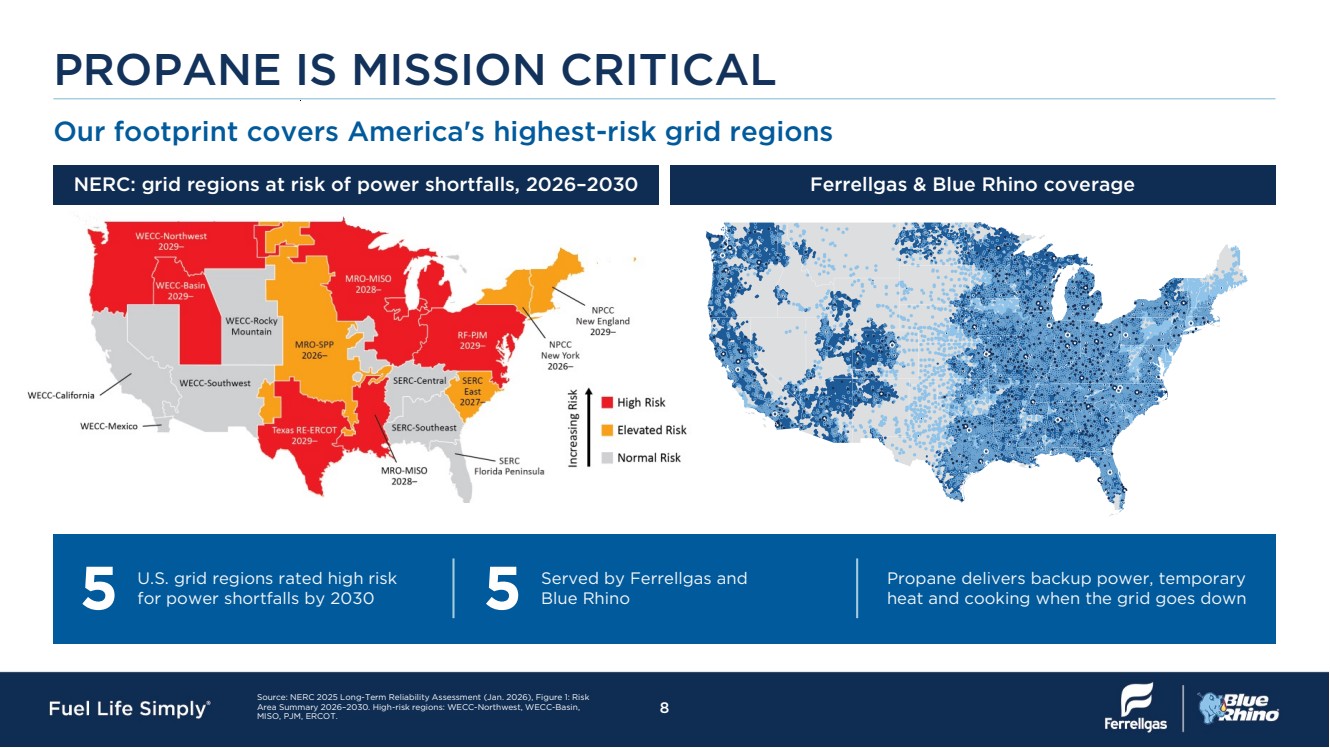
| PROPANE IS MISSION CRITICAL Our footprint covers America's highest-risk grid regions NERC: grid regions at risk of power shortfalls, 2026–2030 Ferrellgas & Blue Rhino coverage 5 U.S. grid regions rated high risk for power shortfalls by 2030 5 Served by Ferrellgas and Blue Rhino Propane delivers backup power, temporary heat and cooking when the grid goes down Source: NERC 2025 Long-Term Reliability Assessment (Jan. 2026), Figure 1: Risk Area Summary 2026–2030. High-risk regions: WECC-Northwest, WECC-Basin, MISO, PJM, ERCOT. 8 |
| Source: LP Gas magazine, 2026 Top Propane Retailers (FY2025 retail gallons): PERC annual Retail Propane Sales Report (2024 U.S. retail total). Amerigas 8.3% Ferrellgas 6.4% Suburban 4.5% Superior Plus 3.6% Growmark 3.2% Independents 74% Propane 5% Other 4% Heating Oil 3% Electricity 43% Natural Gas 45% LARGE, FRAGMENTED ADDRESSABLE MARKET • Propane is a basic necessity to many customers for heating and agricultural purposes • It is a clean burning, multi-use energy source • Alternative to natural gas due to its portability • Generally, less expensive than electricity as a heating source • The US propane market was valued at an estimated $44.85B in 2025 • Overall forecasted market growth at a CAGR of 5.03% between 2026 to 2034 Propane is an Attractive Clean Fuel with Forecasted Market Growth Propane Market Overview 2026 U.S. Heating Sources by Homes • Leading distributor of propane and related equipment in United States • Second largest retail marketer of propane based on 2025 retail sales volume Ferrellgas is a Leading Player in the U.S. Propane Market Propane Market Positioning 2025 U.S. Propane Market Share by Volume1 Source: https://www.marketdataforecast.com/market-reports/united-states-propane-market Note: Primary space heating fuel, sharing of U.S. households as of October 2026 (EIA estimate). “Other” includes wood, other fuels, and no heating fuel. Source: U.S. Energy Information Administration. Winter Fuels Outlook 2026-27 (October 2026), based on U.S. Census Bureau American Community Survey. ¹ Company FY2025 retail gallons as a share of the 2024 U.S. retail total (8.81B gallons), the latest available. Company fiscal years vary figures may not sum to 100% due to rounding. 9 |
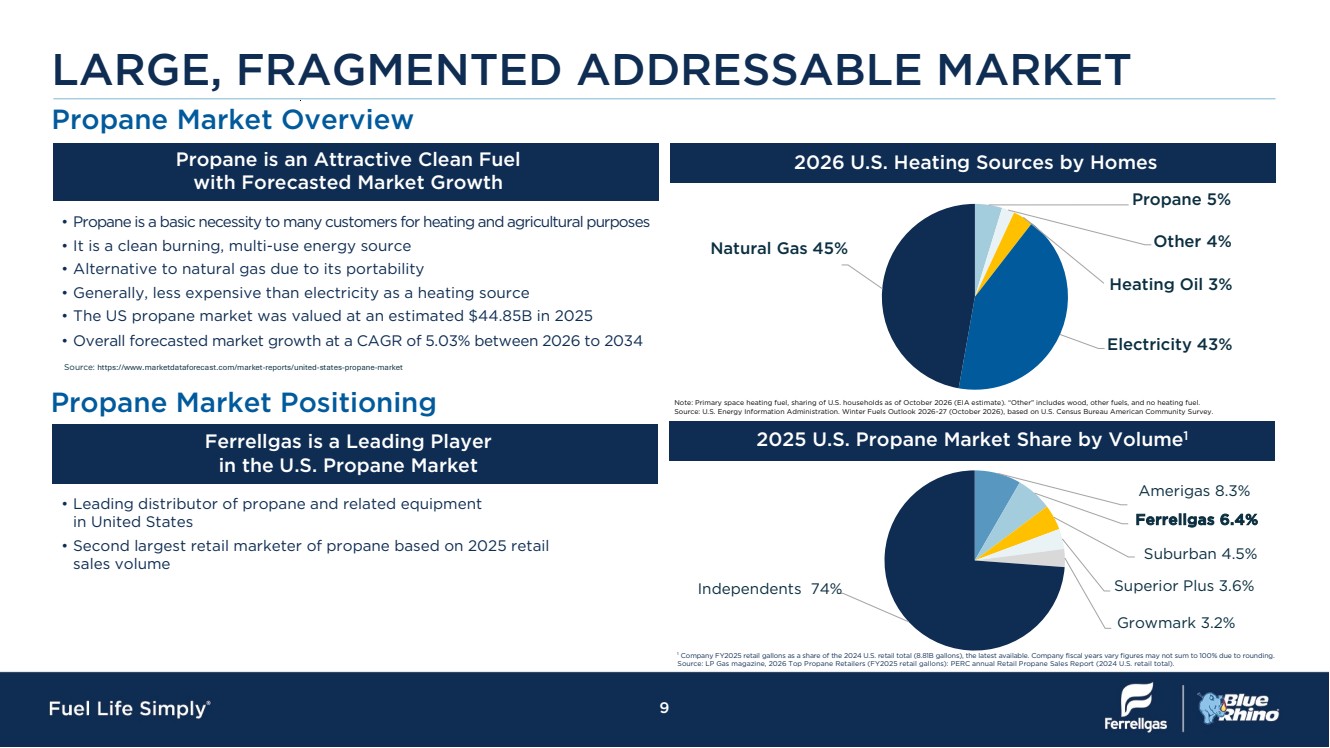
| Over 750M GALLONS procured Average 20+ YEAR relationship with top suppliers Baa3 or higher credit rating across leading suppliers $16M+ in total product LCs from 16 suppliers STRONG RELATIONSHIPS WITH LEADING SUPPLIERS Selected Top Suppliers 10 |
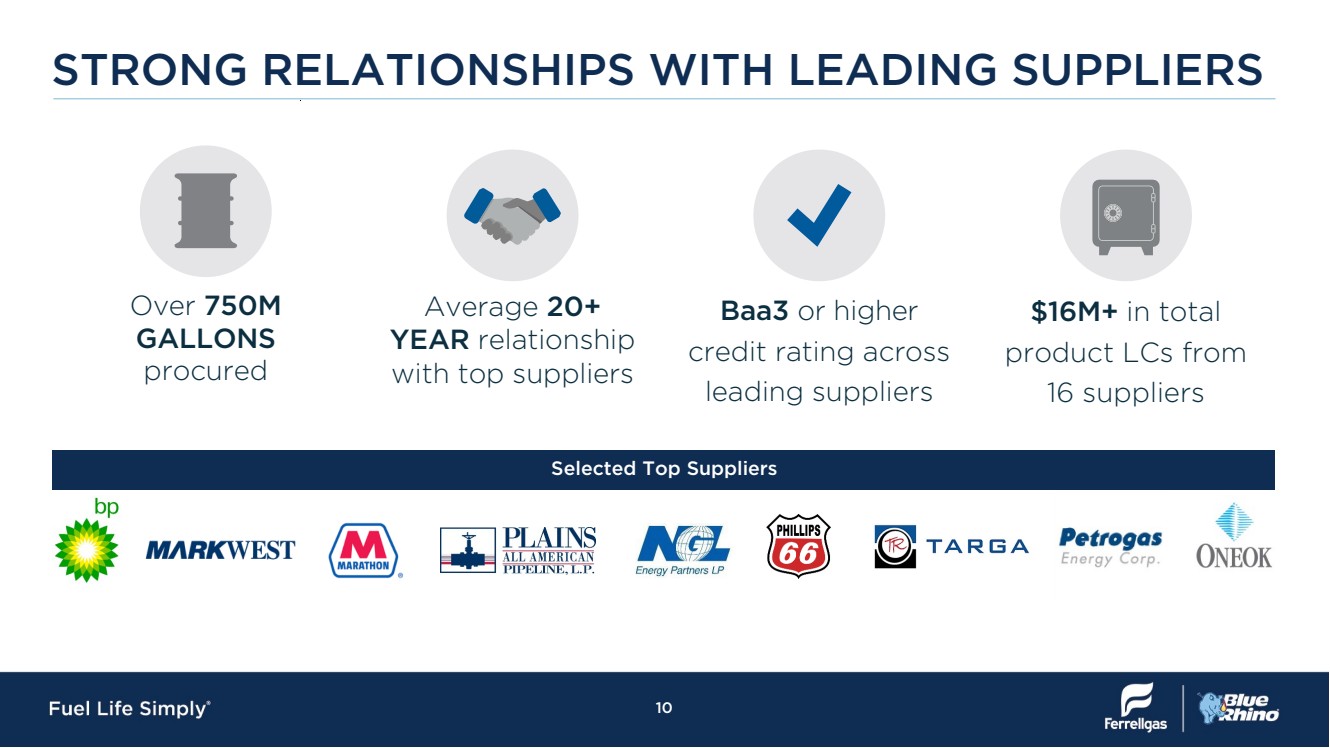
| DIVERSE, BLUE-CHIP CUSTOMER BASE • Current customer locations of ~899,000 including: ◦ ~689,000 residential ◦ ~184,000 industrial / commercial ◦ ~22,000 agriculture ◦ ~4,000 reseller • 70% of residential locations utilize company equipment • Customers in all 50 states, with a concentration in the Midwest • 43% of tank exchange sales are to top 4 major retailers Customer Overview Relationship Summary – FY 2026 Selected Top Customers Top 5 retail clients by gross margin Relationship length 2026 volumes (mm gal) Customer A 25+ 10.7 Customer B 25+ 12.7 Customer C 25+ 5.3 Customer D 25+ 6.8 Customer E 2+ 4.0 11 |
| OPERATIONAL HIGHLIGHTS & INITIATIVES 12 |
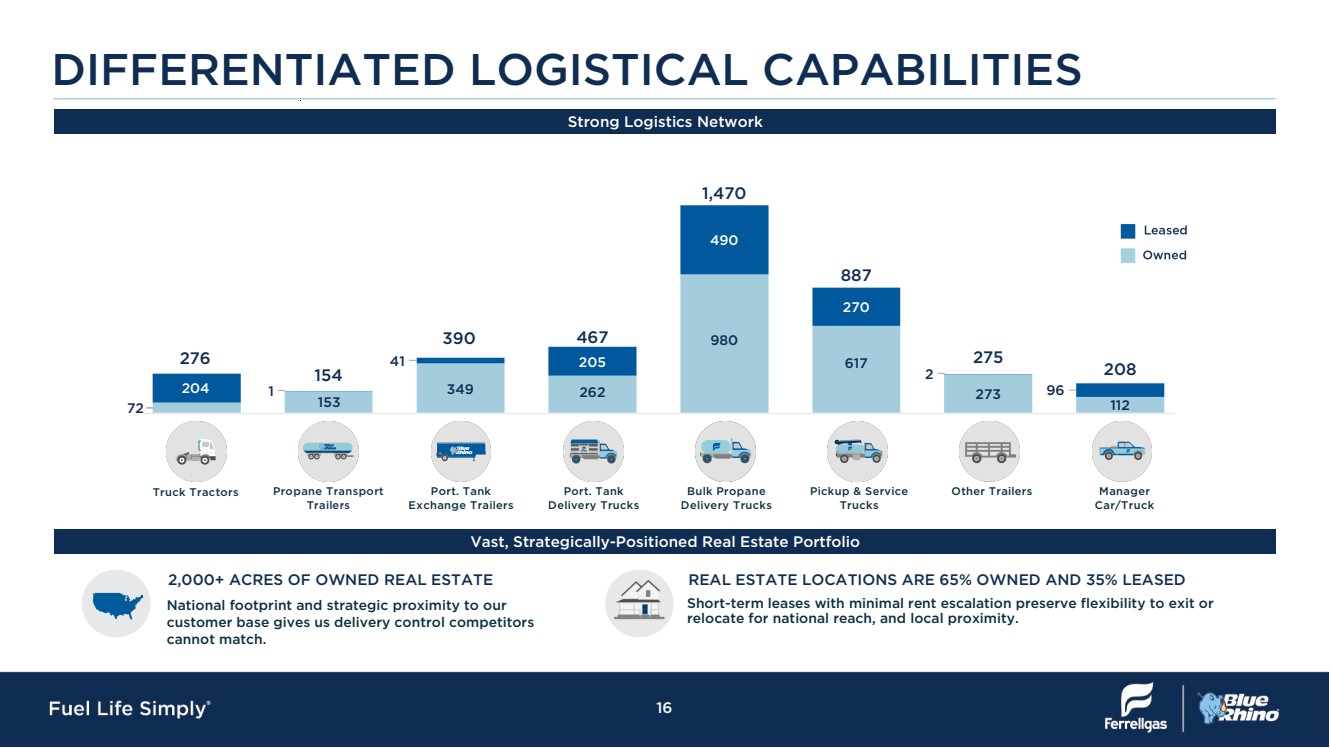
| DIVERSIFIED BUSINESS MIX Balanced business model provides geographic, end market, and channel diversity • Last mile distribution to residential customers for home heating, cooking, and energy • ~70% of residential customers lease Ferrellgas equipment • Propane represents ~5% of the home heating industry • ~50% of rural Americans use propane in their home due to cost, cleanliness and inability to access natural gas • Portable tanks are distributed to Blue Rhino ~65k retail selling locations • Blue Rhino is one of the most recognizable brands in the tank exchange market • Brand recognition is an important value proposition with tanks sold directly to consumers • Industrial/Commercial customers receive deliveries in portable propane cylinders • Forklifts and other light-duty industrial vehicles operate on propane • Recent demand growth driven by the use of outdoor heaters at restaurants • Wide range of applications supporting livestock, crops, and associated energy needs • Logistics and advanced monitoring systems enable increased efficiency for farmers • Propane is the most common choice for on-farm dryers across the Midwest • Propane is a clean burning energy enabling compliance with clean air mandates by government agencies such as school districts and DOT maintenance fleets • Data Center primary and secondary power opportunities are a growth area for the industry and Ferrellgas • Cell Phone Tower and 911 system backup is an important area of social impact and support of important community communication grids Source: Propane Education & Research Council and internal Ferrellgas data. Residential – 31.8% Tank Exchange – 13.2% Industrial/Commercial – 39.8% Agricultural - 4.5% Autogas and Other – 10.7% 13 |
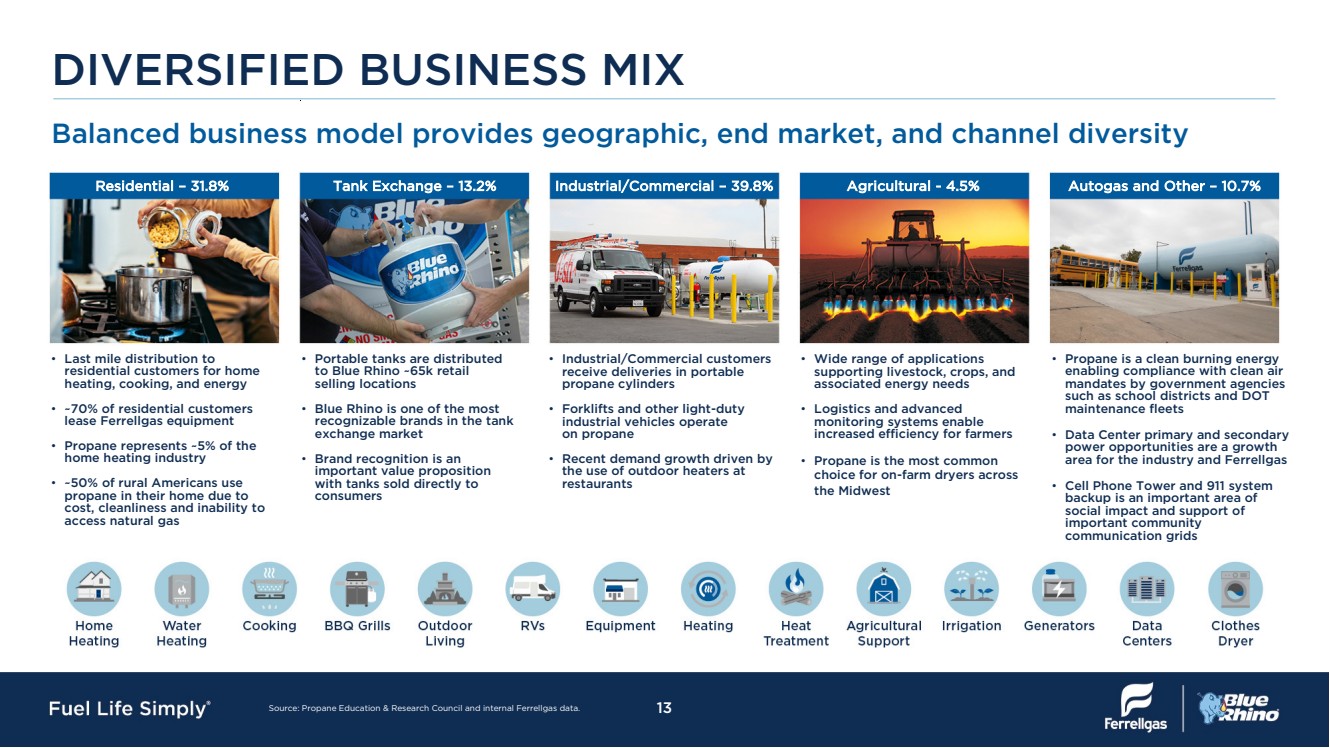
| STRATEGY INSULATES BUSINESS VOLATILITY • 70% of customers purchase propane at spot price + margin, resulting in a pass-through of commodity prices without direct commodity exposure for Ferrellgas • 30% of customers purchase at fixed prices, at which time the company hedges 100% of the contracted volumes to offset variations in commodity pricing Limited Commodity Exposure Seasonality Offset By Counter Seasonal Business FY 2026 Gross Profit ($000) Fixed Prices Floating Prices ~30% ~70% FGP offers the option for customers to buy propane at fixed price Company hedges 100% of the contracted volumes FGP sells propane to customers at spot price + margin Business is a pure pass through of commodity prices; thus, it has no direct commodity exposure • The tank exchange business sees strong demand in the summer and fall grilling seasons, complementing the strong winter demand of Ferrellgas’ retail propane business • Consistent demand for propane helps the company negotiate better pricing from suppliers so that it can offer more competitive pricing to customers Note: Fiscal year-end July 31st Suppliers 14 - 50,000 100,000 150,000 Aug Sep Oct Nov Dec Jan Feb Mar Apr May Jun Jul Retail Wholesale |
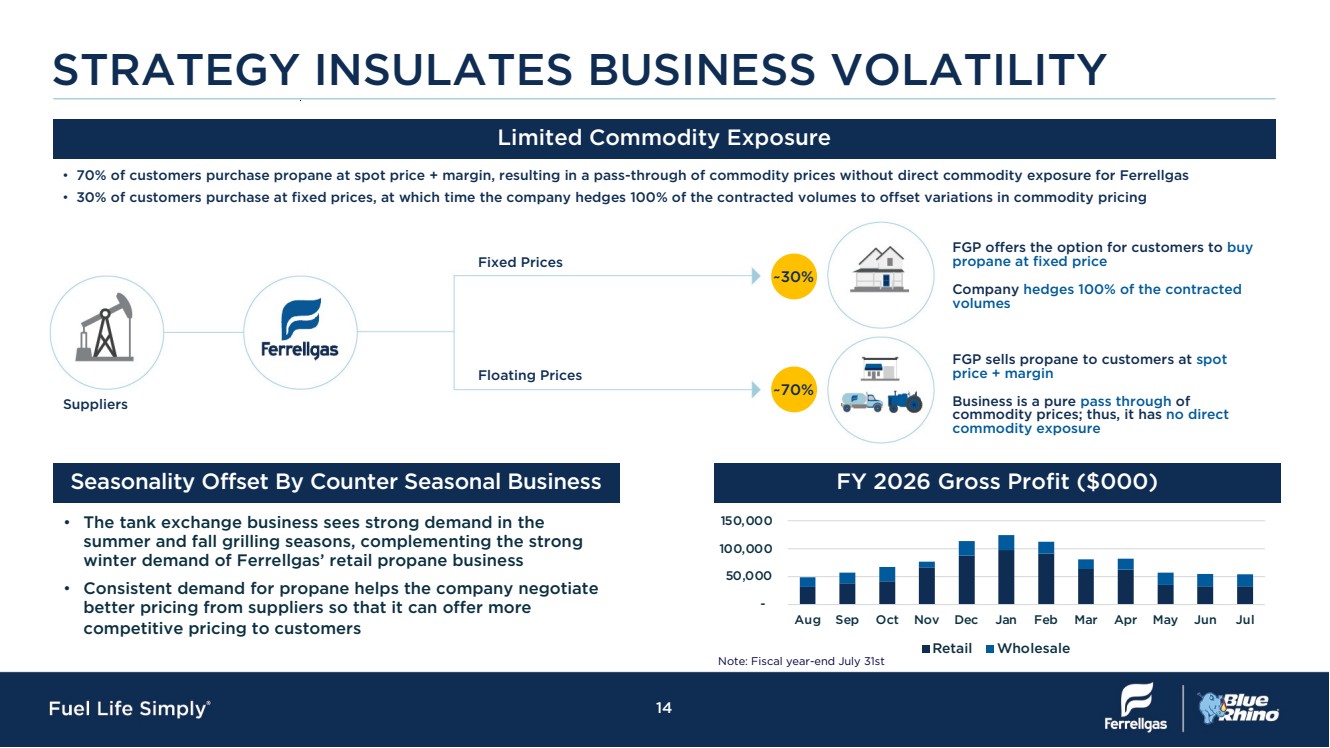
| Vending: Blue Rhino self-service vending units enable consumers to exchange or purchase new propane tanks 24/7. This direct-to-consumer vending technology affords the consumer maximum time savings by removing dependency on a store associate. The real-time communications mobilize our driver fleet in the most efficient way. Mobile Device Technology: Ferrellgas customers and employees rely on real-time data provided through ruggedized mobile technology. This tool enables efficient and accurate processes throughout the order lifecycle. Telematics: Through telematics, our vehicles communicate with drivers, logisticians and managers throughout the day. The information is vital to the safe, efficient and profitable use of our large and agile fleet. Awarded Technology Leader of the Year by leading supplier of Telematics. Refill: Our partnership with gas service stations and hardware locations across the country create another opportunity for consumer sales. Technology at our refill locations allows for safe and measured fills while also communicating inventory levels to our logisticians and delivery representatives. Safety: We adhere to stringent safety protocols, such as regular system inspections, leak detection, and proper maintenance so that our customers can enjoy the benefits of propane without compromising their safety. Tank Monitoring System: Tank Monitor technology gives our customers peace of mind. Using their portal app, they are able to see the propane level of their tank. This technology also optimizes route scheduling, reduces distribution costs and reduces customer response times. FERRELLGAS ELEVATES 15 |
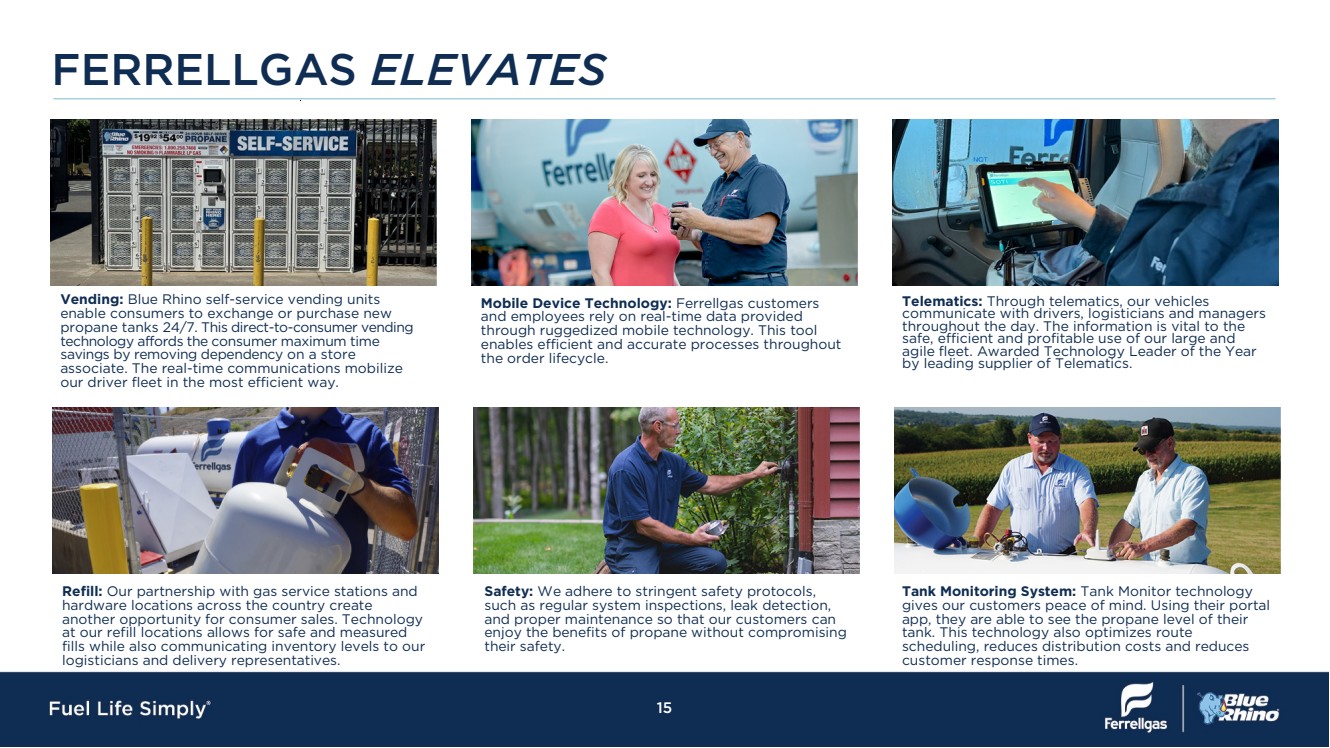
| 72 153 349 262 980 617 273 112 204 1 41 205 490 270 2 96 276 154 390 467 1,470 887 275 208 Strong Logistics Network Vast, Strategically-Positioned Real Estate Portfolio National footprint and strategic proximity to our customer base gives us delivery control competitors cannot match. REAL ESTATE LOCATIONS ARE 65% OWNED AND 35% LEASED Short-term leases with minimal rent escalation preserve flexibility to exit or relocate for national reach, and local proximity. Truck Tractors Propane Transport Trailers Port. Tank Exchange Trailers Port. Tank Delivery Trucks Bulk Propane Delivery Trucks Pickup & Service Trucks Other Trailers Manager Car/Truck 16 DIFFERENTIATED LOGISTICAL CAPABILITIES 2,000+ ACRES OF OWNED REAL ESTATE |
| FINANCIAL UPDATE 17 |
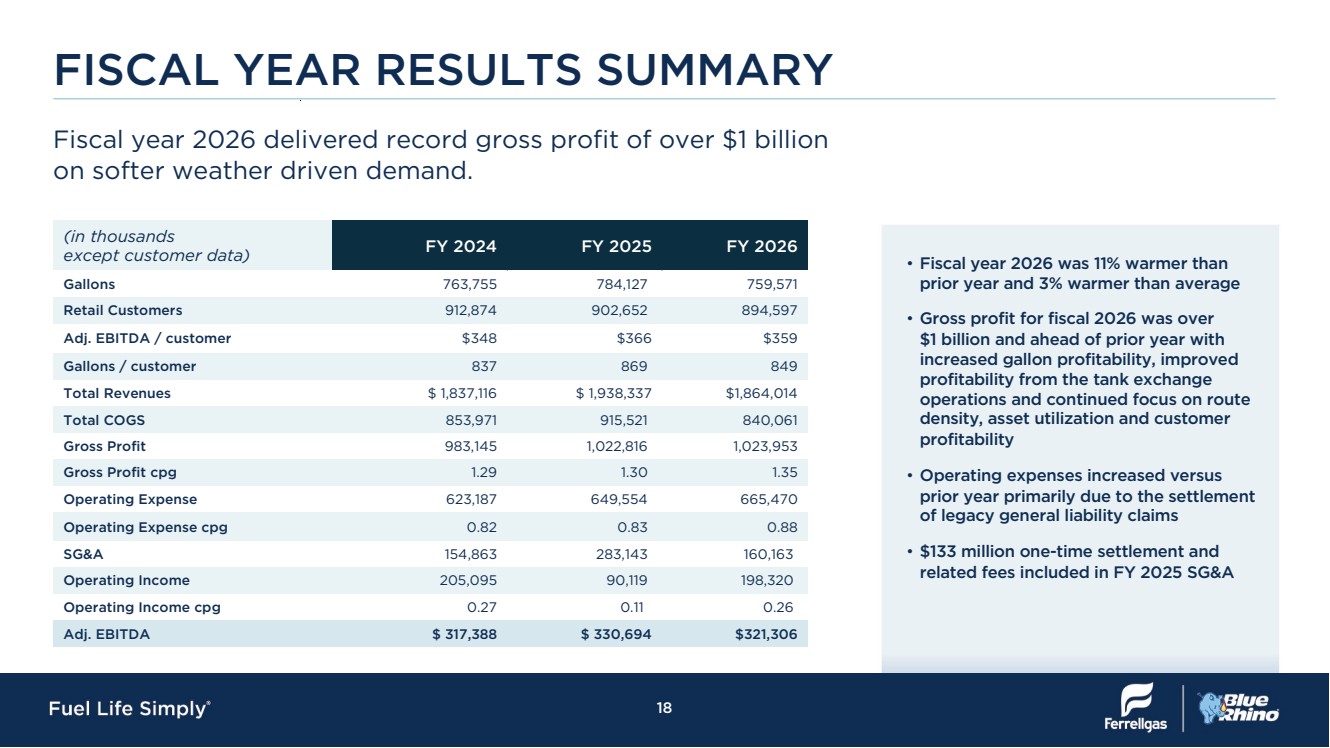
| (in thousands except customer data) FY 2024 FY 2025 FY 2026 Gallons 763,755 784,127 759,571 Retail Customers 912,874 902,652 894,597 Adj. EBITDA / customer $348 $366 $359 Gallons / customer 837 869 849 Total Revenues $ 1,837,116 $ 1,938,337 $1,864,014 Total COGS 853,971 915,521 840,061 Gross Profit 983,145 1,022,816 1,023,953 Gross Profit cpg 1.29 1.30 1.35 Operating Expense 623,187 649,554 665,470 Operating Expense cpg 0.82 0.83 0.88 SG&A 154,863 283,143 160,163 Operating Income 205,095 90,119 198,320 Operating Income cpg 0.27 0.11 0.26 Adj. EBITDA $ 317,388 $ 330,694 $321,306 Fiscal year 2026 delivered record gross profit of over $1 billion on softer weather driven demand. FISCAL YEAR RESULTS SUMMARY • Fiscal year 2026 was 11% warmer than prior year and 3% warmer than average • Gross profit for fiscal 2026 was over $1 billion and ahead of prior year with increased gallon profitability, improved profitability from the tank exchange operations and continued focus on route density, asset utilization and customer profitability • Operating expenses increased versus prior year primarily due to the settlement of legacy general liability claims • $133 million one-time settlement and related fees included in FY 2025 SG&A 18 |
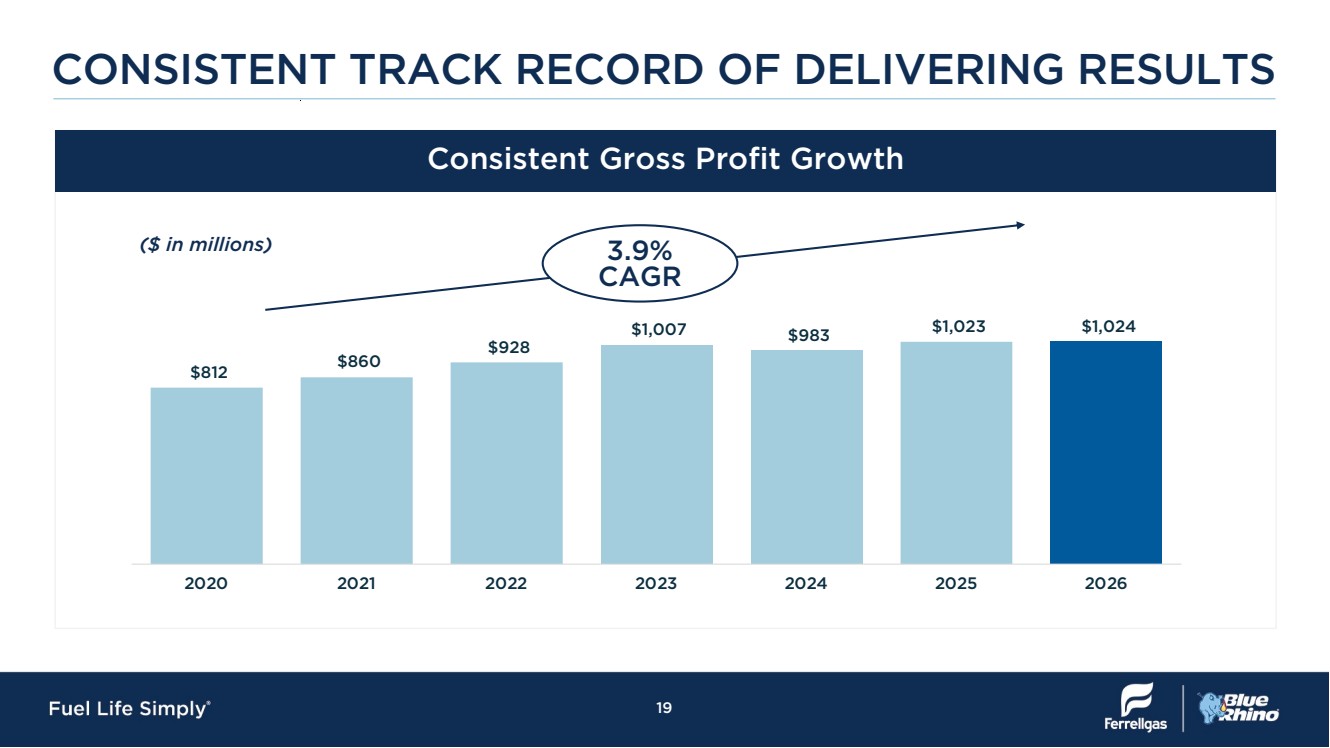
| $812 $860 $928 $1,007 $983 $1,023 $1,024 2020 2021 2022 2023 2024 2025 2026 CONSISTENT TRACK RECORD OF DELIVERING RESULTS ($ in millions) Consistent Gross Profit Growth 3.9% CAGR 19 |
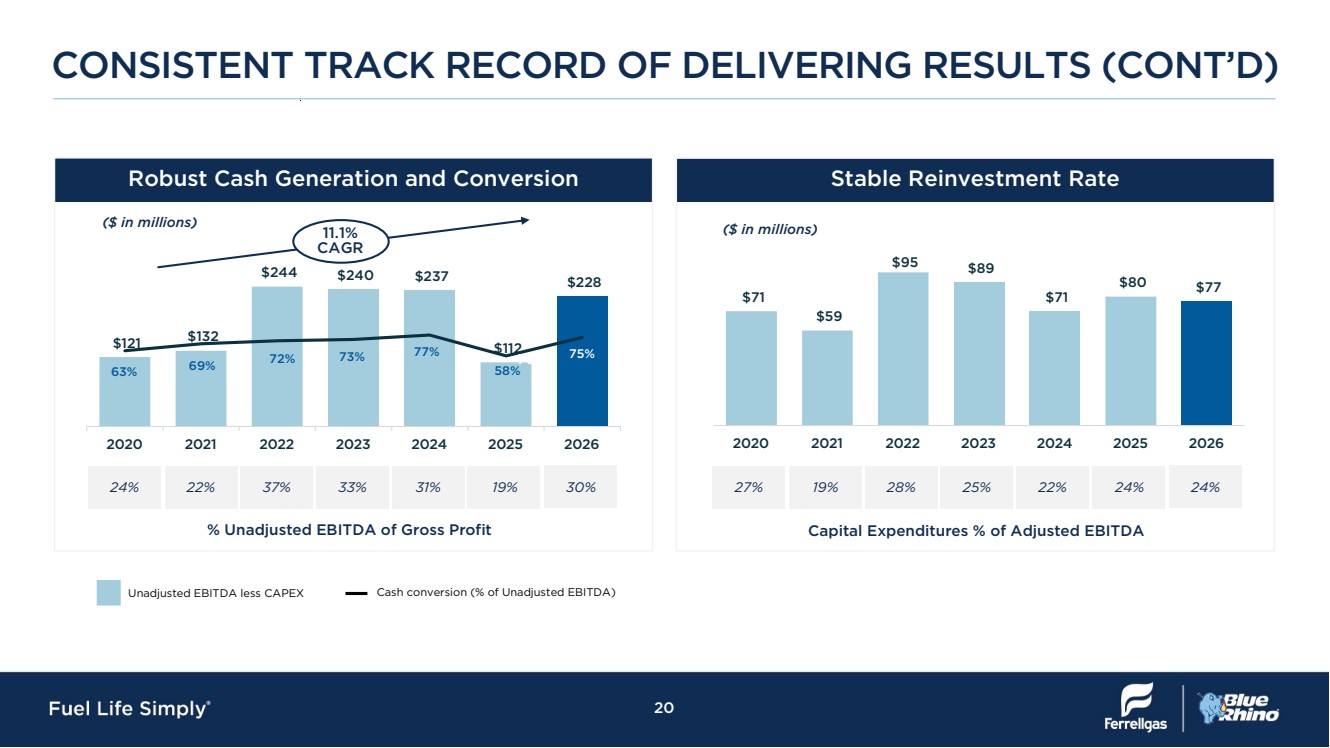
| $121 $132 $244 $240 $237 $112 $228 63% 69% 72% 73% 77% 58% 75% -5% 15% 35% 55% 75% 95% 115% 135% 155% 175% $- $50 $100 $150 $200 $250 $300 $350 2020 2021 2022 2023 2024 2025 2026 $71 $59 $95 $89 $71 $80 $77 2020 2021 2022 2023 2024 2025 2026 CONSISTENT TRACK RECORD OF DELIVERING RESULTS (CONT’D) ($ in millions) Robust Cash Generation and Conversion 11.1% CAGR ($ in millions) Stable Reinvestment Rate 76% 20 % Unadjusted EBITDA of Gross Profit Capital Expenditures % of Adjusted EBITDA 24% 22% 37% 33% 31% 19% 30% 27% 19% 28% 25% 22% 24% 24% Unadjusted EBITDA less CAPEX Cash conversion (% of Unadjusted EBITDA) |
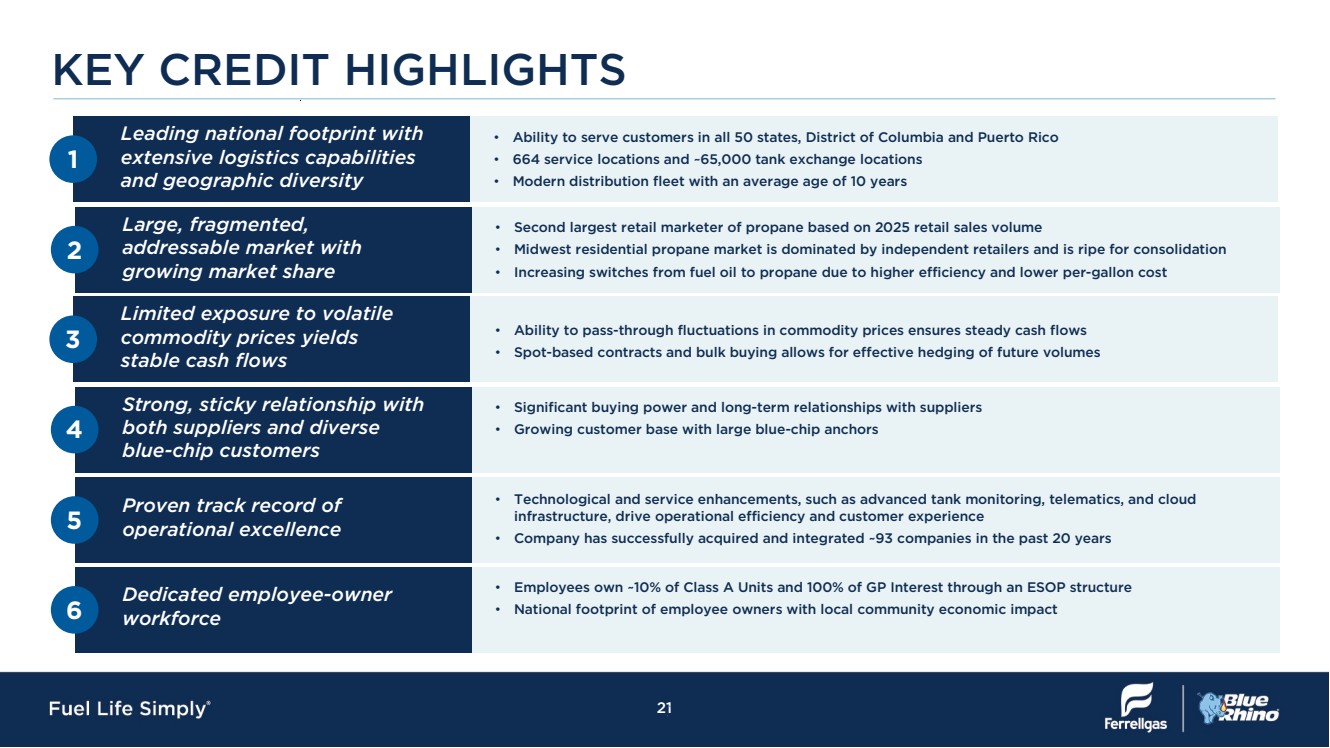
| 1 Leading national footprint with extensive logistics capabilities and geographic diversity • Ability to serve customers in all 50 states, District of Columbia and Puerto Rico • 664 service locations and ~65,000 tank exchange locations • Modern distribution fleet with an average age of 10 years 2 Large, fragmented, addressable market with growing market share • Second largest retail marketer of propane based on 2025 retail sales volume • Midwest residential propane market is dominated by independent retailers and is ripe for consolidation • Increasing switches from fuel oil to propane due to higher efficiency and lower per-gallon cost 3 Limited exposure to volatile commodity prices yields stable cash flows • Ability to pass-through fluctuations in commodity prices ensures steady cash flows • Spot-based contracts and bulk buying allows for effective hedging of future volumes 4 Strong, sticky relationship with both suppliers and diverse blue-chip customers • Significant buying power and long-term relationships with suppliers • Growing customer base with large blue-chip anchors 5 Proven track record of operational excellence • Technological and service enhancements, such as advanced tank monitoring, telematics, and cloud infrastructure, drive operational efficiency and customer experience • Company has successfully acquired and integrated ~93 companies in the past 20 years 6 Dedicated employee-owner workforce • Employees own ~10% of Class A Units and 100% of GP Interest through an ESOP structure • National footprint of employee owners with local community economic impact KEY CREDIT HIGHLIGHTS 21 |
| APPENDIX 22 |
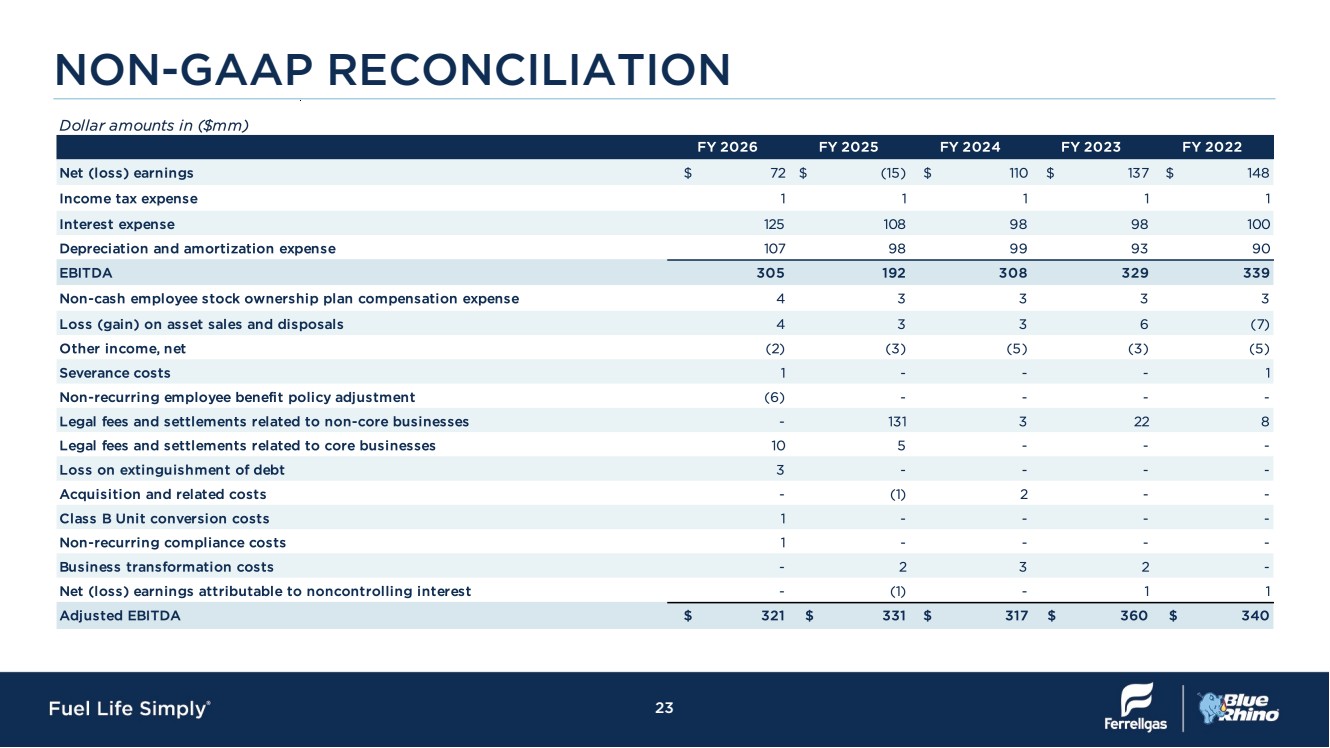
| NON-GAAP RECONCILIATION 23 |